This site uses cookies to improve your experience. To help us insure we adhere to various privacy regulations, please select your country/region of residence. If you do not select a country, we will assume you are from the United States. Select your Cookie Settings or view our Privacy Policy and Terms of Use.
Cookie Settings
Cookies and similar technologies are used on this website for proper function of the website, for tracking performance analytics and for marketing purposes. We and some of our third-party providers may use cookie data for various purposes. Please review the cookie settings below and choose your preference.
Used for the proper function of the website
Used for monitoring website traffic and interactions
Cookie Settings
Cookies and similar technologies are used on this website for proper function of the website, for tracking performance analytics and for marketing purposes. We and some of our third-party providers may use cookie data for various purposes. Please review the cookie settings below and choose your preference.
Strictly Necessary: Used for the proper function of the website
Performance/Analytics: Used for monitoring website traffic and interactions
And like any major problem, this mass exodus of dropouts must be addressed sooner rather than later through innovative interventions. Enter the use of big data and predictive analytics. Big Data Hits the Quad. The “soft” predictors, those subtle hints that are precursors to student dropout. Focus on geotargeted data.
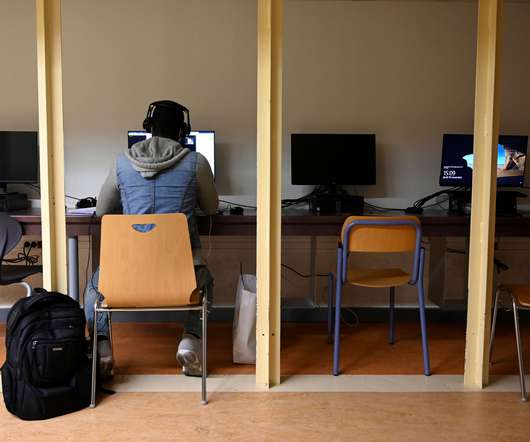
Data indicates that online learning offers flexibility that traditional classrooms often can’t match. Reports highlight that many students struggle with self-discipline in an online environment, leading to higher dropout rates compared to traditional settings. You might wonder why this preference exists.
Like many dropouts, Floyd always intended to finish his college education. The number of college dropouts swelled during the tight labor market; an additional 2 million people joined their ranks from only a year and a half earlier in 2018. As with many dropouts, Floyd had unpaid student debt to resolve.
The lack of motivation has contributed to lower academic performance and increased dropout rates. Recent data shows student engagement and connection are at an all-time low.
At the University of Alaska Anchorage’s Community & Technical College, Associate Dean Kim Griffis says dropouts aren’t considered a failure, if the student has landed a job in the technical field they were training for. Griffis says the college doens’t collect data around how many students this is the case for.) Kim Griffis.
It’s a small but noteworthy example of a new emphasis at colleges and universities on plugging the steady drip of dropouts who end up with little to show for their time and tuition, wasting taxpayer money that subsidizes public universities and leaving employers without enough of the graduates they need to fill jobs. Dickinson stayed.
And the data suggests we are far from solving it. That is why schools that embrace social-emotional learning programs see reduced absenteeism, higher student engagement and motivation, a stronger feeling of community among students, improved academic performance, and fewer dropouts.
The district’s class of 2010 had a 73 percent graduation rate for students in special education and a 13 percent dropout rate — double the dropout rate for the student body overall. The high dropout rate for students with disabilities is a pressing national problem. Covina-Valley has seen its efforts pay off.
Data on Measuring Up. The Measuring Up website avails interested stakeholders to a plethora of data supporting the efficacy of this program in helping students satisfy standards. For example, the National Dropout Prevention Center conducted a year-long study of the Measuring Up program and its impact on student outcomes.
Florence Xiaotao Ran, an assistant professor at the University of Delaware and the lead researcher on the Tennessee study, explained to me that the dropouts appear to be different types of students than the ones earning more credits. Data from other states shows a similar pattern. It’s not their fault,” said Ran.
Key points: Chronic absenteeism leads to much higher dropout rates 5 ways school districts can create successful community partnerships Data gaps negatively impact academic progress and attendance For more on chronic absenteeism, visit eSN’s Educational Leadership hub The biggest problem in education is that kids arent showing up to school.
Our data tells us that 90 percent of them still have a dream of earning their degree,” Horn says. According to the Lumina Foundation , conservative estimates of lifetime earnings for a 19-year-old with some college but no degree was about $701,936. For a 19-year-old with a two-year degree, the number increased by about $93,000.
If we’ve got middle school students (identified through our data points) ready to take on a high school class while they're in middle school, our. In Putnam County, we’ve been talking about identifying where a student is by the data when they come to the classroom. How does tech fit into this?
And we keep wondering about the high rates of dropout students. And when their specific learning needs are met, the percentage of underachievers and dropouts shrinks, engagement rates and the likability of going to school go up, as well as student performance. Big learning data. Kids don’t learn the same.
Lower dropout rates. On a similar note, offering each student the tailored content they need to complete classes and pass exams can reduce dropout rates. Thanks to their powerful AI features, these platforms can collect in-depth data related to student performance as well as class engagement. .
Employers are the ones defining which skills they value, and they can provide a “treasure trove” of data around whether the Imbellus assessment works and how it works, she says. Kantar says it makes more sense for her team to work on the employer side of things, at least for right now. So what about the schools?
’ Both of these practices contribute to students’ learning apathy, boredom, disengagement, perceived lack of relevance in what they’re learning, and dropout rates (both physically and mentally). It’s relatively easy to come up with pedagogical and data systems that help students recall and regurgitate a little better.
The teen birth rate plunged more than 60 percent from 1991 to 2014, the most recent year of data. Child Trends analysis of NSFG 2011-15 data, accessed through the National Center for Health Statistics. The post Fewer teenage mothers, but they still present a dropout puzzle appeared first on The Hechinger Report.
They are developing a recommendation engine to leverage dropout rate data to predict and design interventions for at-risk students. After intervening and supporting approximately 16,000 students, dropout rates have decreased and test scores have improved.
This drives learner engagement, boosts retention rates and reduces the course dropout rates. AI enables fast data analysis and decision making in learning. This data is then used to map out learner behavior and derive insights that streamline the creation of highly personalized and relevant learning paths for each student.
That’s why it might come as surprise to hear AspirEDU , an educational analytics company, pitch their Dropout Detective software as an “academic credit score” for students. Whereas credit scores are designed to prevent risky buyers from getting approved on loans, Dropout Detective is meant to improve student success and lower dropout rates.
And while the technology was all about sophisticated Artificial Intelligence, it used a whole lot of data and analyzed it in real-time to: ensure the authenticity of wins, and. This study of data has now grown into a dedicated field and Data Science learning is becoming a sought-after career. Studying Customer Journeys Better.
With school budgets already limited by a conservative-led state legislature that critics say chronically underfunds public education , the district turned to Diplomas Now, an education nonprofit whose aim is to increase graduation rates using a data-driven system of early intervention. The results have been impressive.
In order to effectively battle increasing dropout rates, educators need to first research statistics and identify specific indicators that lead to high school students falling behind. Ahead of the next school year or semester, our district invited the identified at-risk students to participate in a pilot year of the data-driven STEP program.
While this approach found some success in reducing the dropout rate of students who participated, there were no measurable improvements in achievement. The basic premise - actionable data for educators and timely, “just right” lessons for students - is admirable, but was this the revolution we were looking for?
Dropout rates are high at Swiss universities, where less-prepared students are typically weeded out during the first year, so women probably wouldn’t be dropping out of an introductory economics class in such high numbers here in the United States. In the end, 9 percent of the men dropped the course.
ILPs display learning data to ease teachers’ and school administrators’ work. The system can spot and signal these users so that teachers can close knowledge gaps effectively and prevent more serious problems such as school dropout. . They also offer at-a-glance information about course attendance, course completion rates, and grades.
If we overlay this data with a recent Gallup Poll of one million students, half of which reported feeling disengaged at school, we connect the dots to the loss of autonomy and input as a consequence of our push for accountability.
And the Navy said, rightly, every time we put a ship out to sea, all of those sailors are suddenly college dropouts. But George and I recognize that higher ed is terrible at owning its own data. Even within institutions, we're terrible at data. They don't go to class the next day. We should own this as an industry.
Texas districts reported the highest number of these vague suspensions, but a review of five years of data across 15 other states for which The Hechinger Report obtained data showed school officials citing a broad category such as “other” nearly a million times when suspending students. Related: Become a lifelong learner.
A Stanford University study finds that dropout rates were lower in Oakland, California, high schools that offered a special class for black students called the Manhood Development Program. Nonetheless, the dropouts declined for all black boys who had access to the course. “It shows that it works.”
Research tells us having a person of color teach them has a positive impact on students of all backgrounds, but particularly on the dropout rates of black students. Data transparency is good for school culture Applicant tracking systems also gather data for you, help you manage it, and have built-in compliance tools.
Now, just as happened in the last recession, it is likely to take them even longer and cost more, while — after years of hard-won progress — dropout rates rise and graduation rates fall. In-person events like this have proven to reduce dropout rates for first-year students, but some may be canceled this year because of the pandemic.
The figure comes from 900 universities and colleges that provide employment data for about 370,000 full-time and 90,000 part-time faculty. More than one in four adjuncts earn below the federal poverty level for a family of four, another new report, from the American Federation of Teachers, or AFT, finds.
Fortunately, other data sources are available, from school site visits , student and teacher perception surveys and other tools that many school districts already utilize (think: graduation rates and statistics on student discipline). No single indicator, like standardized test scores , can fully capture the complexity of school quality.
While many schools experienced disappointing data around student achievement during the COVID-19 pandemic, Wolf Creek Public Schools continued to thrive. In fact, dropout rates were reduced to 2.2% target and five points below the provincial average dropout rate of 2.7%. From pandemic to performance . in 2020, well below the 2.9%
Meanwhile, the overall dropout rate at regional voc-techs is 0.5 percent statewide dropout rate, according to 2020-21 Massachusetts Department of Elementary and Secondary Education data, and special needs students fare particularly well at voc-tech schools. percent , even lower than the overall 1.5
Significantly higher dropout rates. Retention has found to be a stronger predictor of student dropout than socioeconomic status or parental education. They represent sound educational practice backed by data. For example, one study showed that 65% to 90% of overage children in grade 9 do not persist to graduation. Related Posts.
Department of Education data analyzed by The Hechinger Report. These and other challenges mean that, at a time when growing proportions of high school students have been successfully encouraged to go on to college, more than one in five full-time freshmen nationwide fail to return for a second year, according to the data.
The data set ranges from pupil-teacher ratio to dropout rate to median standardized-test scores. Next page: The 10 worst school systems; more in-depth data). For full methodology, click here.]. The Top 10 School Systems. Massachusetts. New Jersey. New Hampshire. New Hampshire. Wisconsin. Minnesota. Connecticut.
million students from fall 2019 to fall of 2021, according to state data leaving campuses worried about their future and potential students with fewer of the opportunities offered by higher education. In total, data showed students owed the district $10 million for all debts. The median debt forgiven was just $41. “If
But data released from the statistics division of the U.S. It’s unclear from the current data if the dropout rates for first-generation students are improving or worsening. That figure reflects dropout rates, too. Economists have been finding that it’s getting harder to move up in America.
Considering that these data don’t include dropouts, it seems safe to say that no more than one in three American high-school students is capable of hitting the College Board’s benchmark. In these states in 2015, the percentage of students averaging at least 500 on the reading section ranged from 33 percent (in D.C.) via [link].
Earlier data from summer course taking suggested that Black students might be dropping out of college at higher rates than other races and ethnicities. But the fall data show that white students are now matching these same high dropout rates.
We organize all of the trending information in your field so you don't have to. Join 34,000+ users and stay up to date on the latest articles your peers are reading.
You know about us, now we want to get to know you!
Let's personalize your content
Let's get even more personalized
We recognize your account from another site in our network, please click 'Send Email' below to continue with verifying your account and setting a password.


Let's personalize your content